Cassandra ClientRequest metrics
Cassandra records a set of ClientRequest metrics that record min, max, mean as
well as a set of percentiles for reads, writes, CAS reads and CAS writes.
You can get these via JMX, nodetool or my preferred method is to export them to a system like Graphite with the metrics-report configuration. Opscenter can also be used but given it is no longer compatible for OS Apache Cassandra I don’t use it even with DSE as I want a consistent way to manage Cassandra clusters.
Metrics in Cassandra are prefixed with
org.apache.cassandra.metrics which I’ll abbreviate to o.a.c.m.
The metrics we’re interested in are:
o.a.c.m.ClientRequest.{Read, Write, CASRead, CASWrite}.Latency.{Mean, Min, Max,
75thPercentile, 99thPercentile, 999thPercentile}
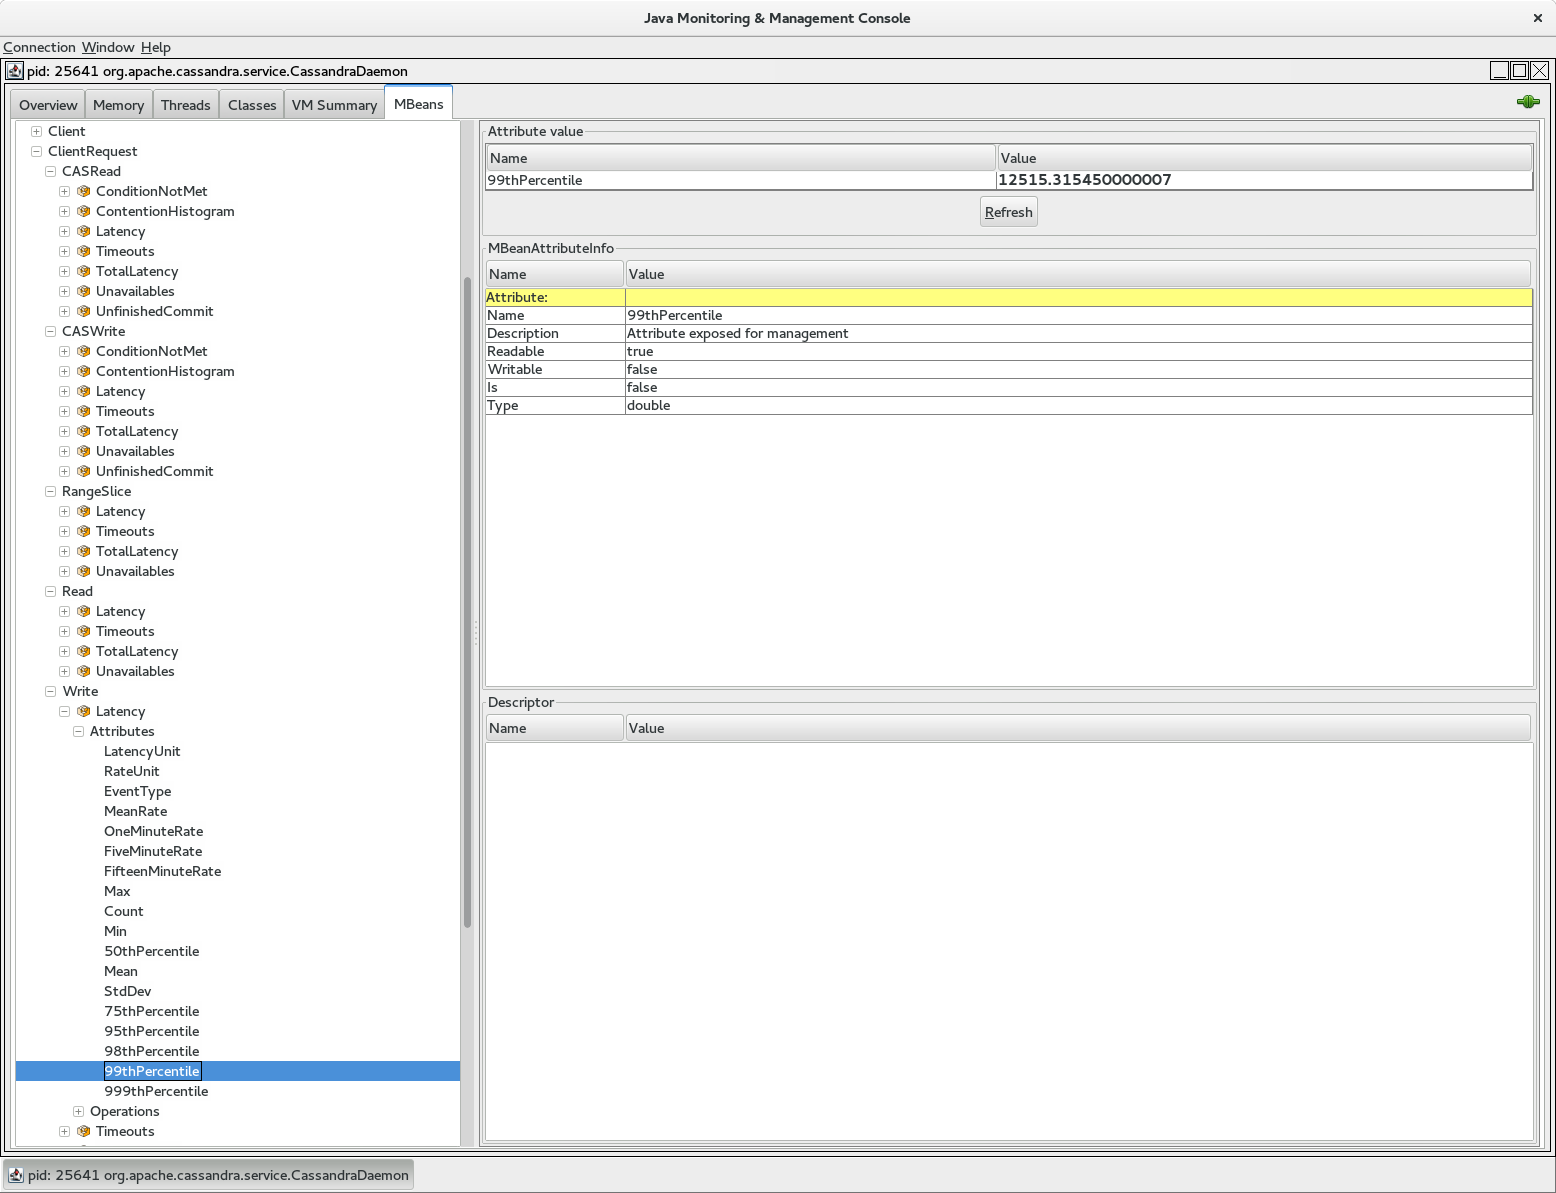
You can see these in a JMX viewer such as jconsole:

You can get access to them via node tool with: nodetool proxyhistorgrams
proxy histograms
Percentile      Read Latency     Write Latency     Range Latency
                    (micros)          (micros)          (micros)
50%                    60.00             42.00              0.00
75%                    72.00             60.00              0.00
95%                   103.00             86.00              0.00
98%                   124.00            103.00              0.00
99%                   149.00            124.00              0.00
Min                    21.00             13.00              0.00
Max                 11864.00          11864.00              0.00
When writing this I noticed that the CASRead and CASWrite metrics were missing so I added them in this jira.
With nodetool you are seeing the figures of a single node when it was the coordinator.
One intersting feature of nodetool is that when you run proxyhistograms it
also resets the data. This is useful if you want to to see performance over the
last few minutes but can be annoying if multiple people are looking at the same
cluster.
Finally my favourite way of viewing the metrics is to push them out to Graphite:

Notice that the 99th percentile is being plotted and the nodes in the cluster are being plotted separately. Don’t be tempted to average the figures as this makes no sense for percentiles.
A huge advantage of publishing the metrics into an external system like graphite is you can look at historical data and see all your nodes in one place.
Meaning
What do these numbers mean? For that we need to understand a little about Cassandra’s internal architecture. In extremely simplistic terms Cassandra has three layers:
- Native protocol for CQL: Accepts client connections
- Dynamo: for handling calling out to other nodes to meet the requested consistency
- Storage: Persisting the node’s data on disk
The ClientRequest latencies, or proxy stats, are recorded at the Dynamo layer
(called the StorageProxy in the C* code in o.a.c.service package). So it includes:
- Calls out to other nodes to meet consistency
- Local disk access if necessary
What’s not included:
- Network between client and server
- De-serialising the message
- Serialisation on the way out
- Any GC/OS pauses in the above two
So don’t be surprised if the ClientRequest metrics are substantially lower than what your application perceives. They are just one piece of the puzzle. To get get the full picture you also need to record:
- Read/Write request metrics from the driver or your own data points before entering the driver
- Full service time from your application’s point of view
That way you’ll know where the latency lies.